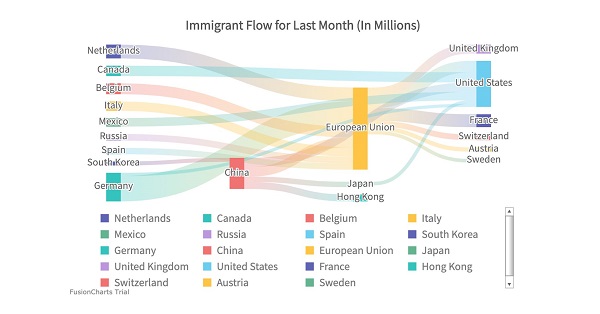
Sankey Diagram - an Overview with FusionCharts (Computers - Software)

Item ID 2476277 in Category: Computers - Software
Sankey Diagram - an Overview with FusionCharts | |
A Sankey Diagram is a flowchart that visualizes the movement of resources, energy, or data between entities. The diagram features arrows, with the width of each arrow proportional to the quantity it represents, providing a clear view of the flow distribution. Sankey Diagrams are particularly useful for illustrating energy efficiency, resource allocation, and process flows. For more information about the Sankey Diagram, visit the FusionCharts blog.  | |
| Related Link: Click here to visit item owner's website (0 hit) | |
| Target State: All States Target City : All Cities Last Update : 02 September 2024 10:36 PM Number of Views: 85 | Item Owner : FusionCharts Contact Email: Contact Phone: (None) |
| Friendly reminder: Click here to read some tips. | |
© 2025 AUNetAds.com
USNetAds.com | GetJob.us | CANetAds.com | UKAdsList.com | INNetAds.com | CNNetAds.com | Hot-Web-Ads.com | USAOnlineClassifieds.com
2025-04-05 (1.007 sec)